Peptide Molarity Calculations: From Milligrams to Micromolar, Corrected for Net Peptide Content
Peptide molarity maths with worked examples: mass to moles, stock and working solutions, net peptide content, counter-ions, UV checks and serial dilutions.
By the APL Research Team · Updated · First published · 6 min read
Experimental designs are written in molar units, while peptide vials are labelled in milligrams, and converting between them takes three steps of arithmetic plus one correction that is often skipped. The steps are mass to moles, moles to stock concentration, and stock to working dilution; the correction accounts for the counter-ions and water that make up part of every lyophilised peptide's mass. This guide sets out the formulas, works examples with real sequences, and shows where errors of 1%, 30% and 1,000-fold come from.
The formulas
| Quantity | Formula | Units |
|---|---|---|
| Amount | n = m ÷ MW × 1,000 | µmol, from m in mg and MW in g/mol |
| Stock concentration | C = n ÷ V | mM, from n in µmol and V in mL |
| Mass concentration to molar | C (µM) = C (µg/mL) × 1,000 ÷ MW | µM |
| Dilution | C1V1 = C2V2 | any consistent units |
| Net peptide correction | n(true) = n(nominal) × NPC | NPC as a fraction |
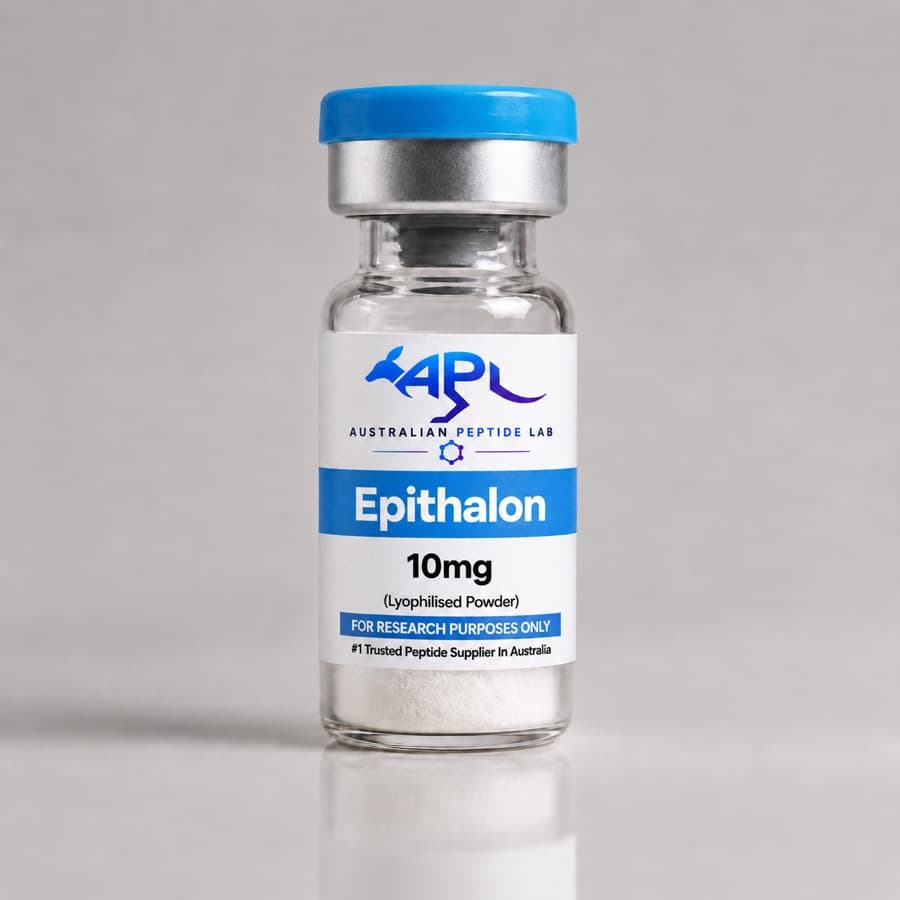
The third line gives a useful constant for each peptide: 1 µg/mL equals 1,000 ÷ MW micromolar. For BPC-157 that is 0.70 µM per µg/mL; for Epithalon, at 390.35 g/mol, it is 2.56 µM per µg/mL. The same mass concentration of two peptides can therefore differ several-fold in molar terms, which matters whenever peptides are compared at "equal" doses in vitro. Molarity and molecular weight cover the definitions.
Worked example: from vial to working solution
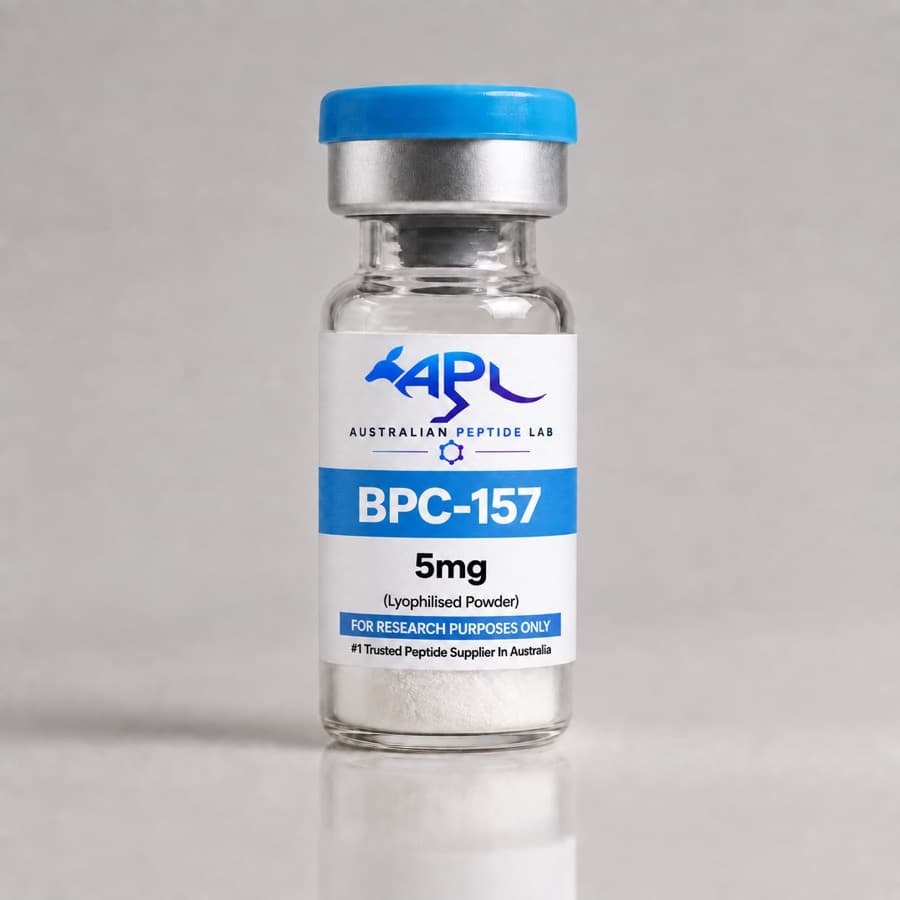
BPC-157, average MW 1419.54 g/mol, 5 mg vial, reconstituted in 2.0 mL:
| Step | Calculation | Result |
|---|---|---|
| 1. Mass to amount | 5 mg ÷ 1419.54 g/mol × 1,000 | 3.522 µmol |
| 2. Stock concentration | 3.522 µmol ÷ 2.0 mL | 1.761 mM (2.5 mg/mL) |
| 3. Working dilution, 10 µM in 10 mL | V1 = 10 µM × 10,000 µL ÷ 1,761 µM | 56.8 µL of stock + 9.943 mL diluent |
Worked example: working backwards from a target
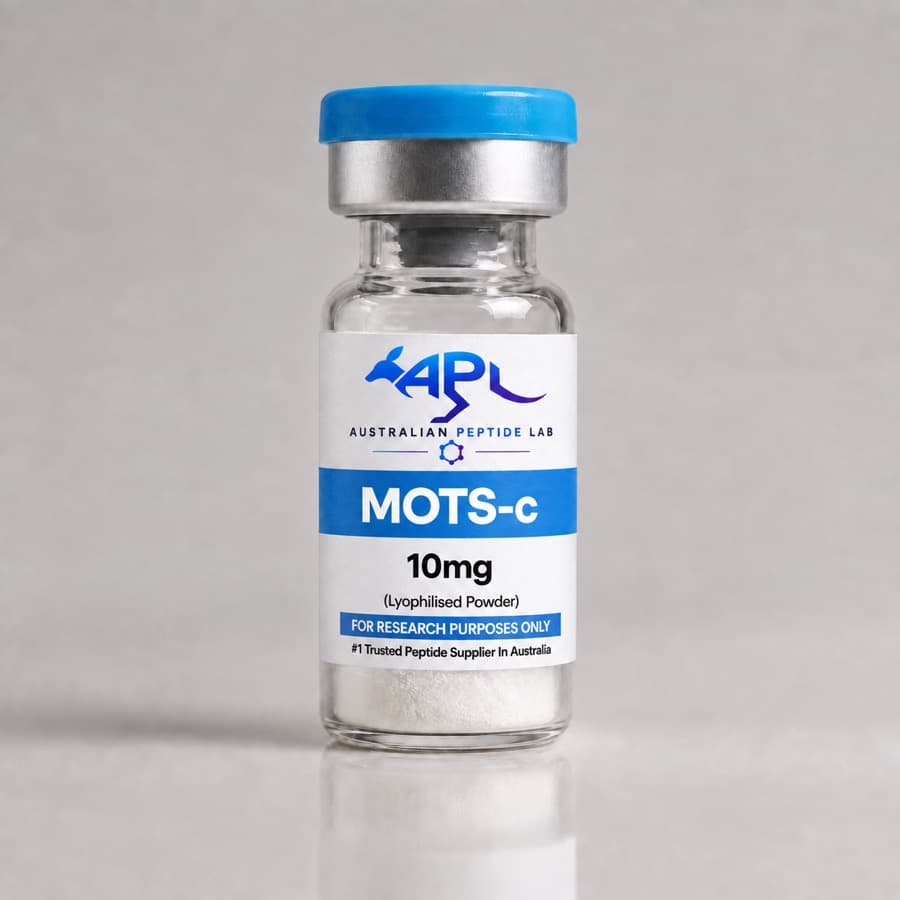
To make a 1.0 mM stock of MOTS-c (MRWQEMGYIFYPRKLR, average MW 2174.59 g/mol) from a 10 mg vial:
| Step | Calculation | Result |
|---|---|---|
| Amount in the vial | 10 mg ÷ 2174.59 × 1,000 | 4.599 µmol |
| Volume for 1.0 mM | 4.599 µmol ÷ 1.0 mM | 4.60 mL |
| Mass per mL at 1.0 mM | 1.0 µmol × 2174.59 g/mol | 2.17 mg |
Use the average molecular weight for all weighing and concentration work. The monoisotopic mass (2173.11 Da for MOTS-c) is for interpreting mass spectra; the peptide molecular weight calculator reports both.
Net peptide content
A lyophilised synthetic peptide is not pure peptide by mass. It also contains counter-ions from purification, residual water and minor peptide impurities, so HPLC purity and net peptide content answer different questions. Reference-standard laboratories assign content by mass balance, measuring each non-peptide component and subtracting it from the total, then use that bulk material to calibrate vialled standards [1]. For synthetic glucagon, water by Karl Fischer titration, trifluoroacetate by ion chromatography, inorganic ions by ICP-MS and related peptides by high-resolution MS were subtracted to give 896.36 ± 0.68 mg of glucagon per gram [2]. Even carefully purified material was about 10% non-peptide by mass.
Methods differ in reliability. In a multi-laboratory study using oxytocin, HPLC assay against a standard of the same bulk material gave the lowest between-laboratory variability, quantitative NMR was proposed as a simpler primary method, and amino acid analysis was the third option compared [3]. Amino acid analysis also carries a trap: in a candidate angiotensin I reference material, related peptide impurities amounted to 10.4 mg/g, and ignoring them would have introduced a 1% error into concentrations determined by amino acid analysis [4].
How much mass can counter-ions account for?
Peptides made by solid-phase synthesis and purified by reversed-phase HPLC are commonly obtained as trifluoroacetate salts, and the amount of counter-ion depends on the sequence, especially its positive charges [5]. The table assumes one counter-ion per free N-terminus, Lys and Arg, using 114.02 g/mol for trifluoroacetic acid and 60.05 g/mol for acetic acid. These are calculated illustrations, not specifications for any product, and they exclude water.
| Peptide | Average MW | Basic groups | Peptide fraction as TFA salt | Peptide fraction as acetate salt |
|---|---|---|---|---|
| Epithalon | 390.35 | 1 | 77.4% | 86.7% |
| BPC-157 | 1419.54 | 2 | 86.2% | 92.2% |
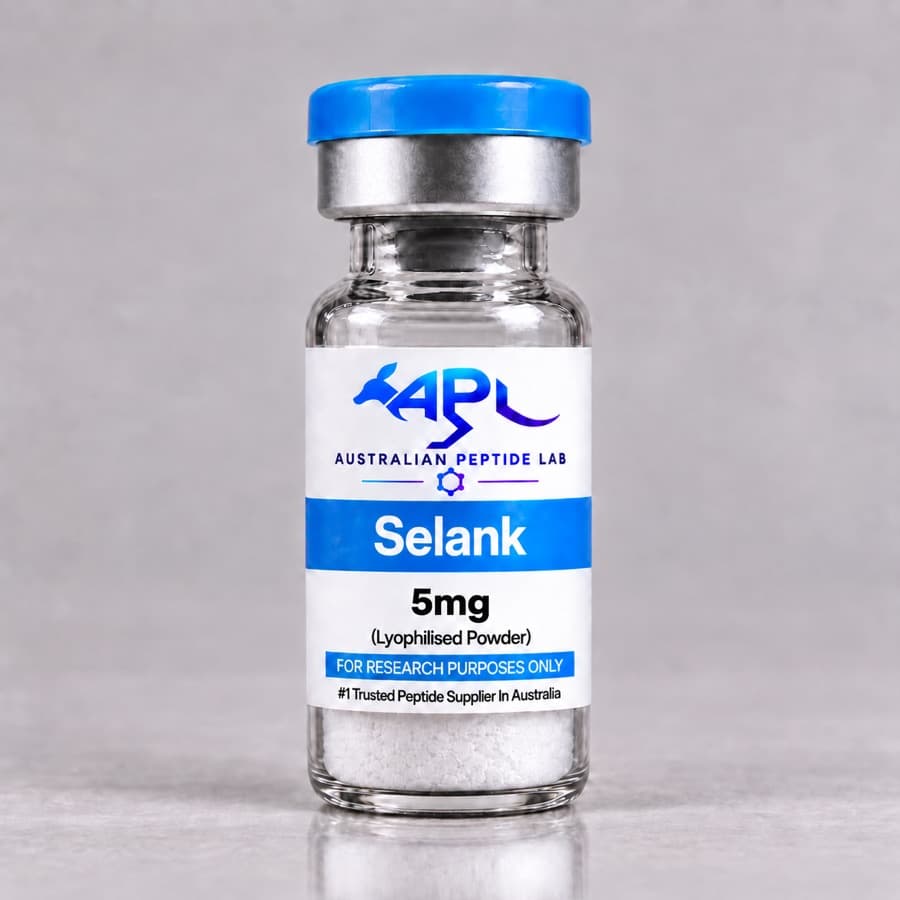
| Selank | 751.87 | 3 | 68.7% | 80.7% |
| MOTS-c | 2174.59 | 5 | 79.2% | 87.9% |
Small, basic peptides are hit hardest. Ignoring a 68.7% peptide fraction overstates the molar concentration by 46% (1 ÷ 0.687). Applied to Selank, 10 mg in 2.0 mL is nominally 6.65 mM; at a net peptide content of 70% it is 4.66 mM. Batch documentation states what applies to a given lot, and TFA vs acetate peptide salts explains the salt forms.
The counter-ion also travels into the assay. Trifluoroacetate at 10⁻⁸ to 10⁻⁷ M reduced proliferation of osteoblasts and chondrocytes, and the TFA salts of amylin and calcitonin gave consistently lower proliferation than their hydrochloride salts [6]. Selank at 10 µM as a tris-trifluoroacetate would carry 30 µM of the anion, 300 to 3,000 times that range.
Checking concentration by UV absorbance
Calculated concentrations can be checked against absorbance. At 280 nm, the molar extinction coefficient of a folded protein in water is best predicted as ε280 = 5,500 × (number of Trp) + 1,490 × (number of Tyr) + 125 × (number of cystines) M⁻¹ cm⁻¹, with the caveats that predictions are less reliable without Trp and that measuring ε is better than predicting it [7]. For a short peptide the figure is an estimate.
MOTS-c contains one Trp and two Tyr, giving ε280 ≈ 8,480 M⁻¹ cm⁻¹. A 2.30 mM nominal stock diluted 1:20 to 115 µM should read A280 ≈ 0.975 in a 1 cm cell. A reading of 0.78 would put the stock at about 80% of nominal, consistent with a net peptide content near 0.8.
BPC-157, Selank and Epithalon contain neither Trp nor Tyr, so A280 is useless for them. Absorbance at 205 nm, dominated by the peptide bond, can be used instead, with molar absorptivity predicted from the sequence without calibration [8]. Buffers and additives that absorb at 205 nm have to be avoided in the measurement.
Serial dilutions for concentration–response work
A half-log series covers three orders of magnitude in seven points. Each step is a 1:3.16 dilution, for example 316 µL of the previous concentration plus 684 µL of diluent:
| Point | Concentration | Point | Concentration |
|---|---|---|---|
| 1 | 100 µM | 5 | 1.00 µM |
| 2 | 31.6 µM | 6 | 0.316 µM |
| 3 | 10.0 µM | 7 | 0.100 µM |
| 4 | 3.16 µM |
Make the series in the same vehicle throughout so solvent and counter-ion concentrations stay constant or scale predictably, and avoid transfer volumes of only a few microlitres, where pipetting error is proportionally largest. Designing dose–response experiments covers spacing and replication, and the dilution calculator handles each step.
Losses at low concentration
Arithmetic assumes every molecule stays in solution, and at low concentrations that fails. Cetrorelix at 0.2–4 µg/mL adsorbed to vial surfaces enough to make HPLC responses poor and variable [9], and recovery of eight endocrine peptides from glass and plastic tubes varied widely by surface, improving when 1% albumin was added [10]. Nanomolar working solutions in plain buffer can therefore hold less peptide than calculated. Prepare them fresh from a concentrated stock, in low-binding tubes and, where the assay permits, in buffer containing a carrier protein.
Where errors come from
| Error | Typical size | Prevention |
|---|---|---|
| mL and µL confused | 1,000-fold | Write units at every step |
| µg/mL treated as µM | Factor of 1,000 ÷ MW | Convert explicitly |
| Gross fill treated as peptide | 16–46% in the TFA-salt examples above, before water | Apply net peptide content |
| Losses to surfaces in dilute solutions | Variable, can dominate at ng/mL | Concentrated stocks; carrier protein |
| Pipetting very small volumes | Several percent or more | Intermediate dilutions |
| Volume of co-solvent additions ignored | Depends on the additions | Recalculate after every addition |
| Average and monoisotopic MW mixed | Under 0.1% for MOTS-c | Use average MW |
The reconstitution calculator gives the stock concentration and the peptide amount per aliquot, the molarity calculator converts between mass and molar units, and the peptide reconstitution guide covers the bench steps around the numbers. What a certificate of analysis does and does not report is covered in understanding certificates of analysis.
Frequently asked questions
How is a peptide mass converted to a micromolar concentration?
Divide the mass by the average molecular weight to get moles, then by the volume. For BPC-157 (1419.54 g/mol), 5 mg is 3.522 µmol, and in 2.0 mL that is 1.761 mM, or 1,761 µM. A handy shortcut: 1 µg/mL equals 1,000 ÷ MW µM, so 1 µg/mL of BPC-157 is 0.70 µM. The molarity calculator does the conversion in either direction.
What is net peptide content and why does it change the maths?
It is the fraction of the powder's mass that is the peptide itself, after counter-ions, water and other non-peptide material are excluded. Reference laboratories assign it by mass balance, measuring and subtracting each component [1]; a carefully characterised synthetic glucagon came out at 896 mg of peptide per gram [2]. Multiplying the fill by this fraction gives the true molar amount.
Should average or monoisotopic molecular weight be used?
Average molecular weight for anything involving weighing or concentration, because a bulk sample contains the natural mix of isotopes. Monoisotopic mass is for reading mass spectra. For MOTS-c the two differ by about 1.5 Da in 2,175, so the choice barely affects molarity, but the peptide molecular weight calculator reports both to avoid confusion.
How can a peptide stock concentration be checked?
For peptides containing tryptophan or tyrosine, absorbance at 280 nm with a sequence-predicted extinction coefficient gives a quick estimate [7]. Peptides lacking both can be measured at 205 nm, where coefficients can also be predicted from sequence [8]. HPLC assay against a reference standard showed the lowest between-laboratory variability in a multi-laboratory comparison [3].
Does the counter-ion matter if the peptide concentration is correct?
It can. Trifluoroacetate at 10⁻⁸ to 10⁻⁷ M reduced osteoblast and chondrocyte proliferation, enough to mask or invert a peptide's apparent effect [6]. A peptide at 10 µM carrying three trifluoroacetates per molecule brings 30 µM of the anion into the well. See TFA vs acetate peptide salts.
References
- 1.McCarthy D, Han Y, Carrick K, et al. Reference Standards to Support Quality of Synthetic Peptide Therapeutics. Pharm Res. 2023. PubMed 36949371
- 2.Wang X, Zhang F, Li H, et al. Purity determination of synthetic glucagon using a mass balance approach. Sci Rep. 2020. PubMed 32157163
- 3.Li C, Bhavaraju S, Thibeault MP, et al. Survey of peptide quantification methods and comparison of their reproducibility: A case study using oxytocin. J Pharm Biomed Anal. 2019. PubMed 30640042
- 4.Stoppacher N, Josephs RD, Daireaux A, et al. Impurity identification and determination for the peptide hormone angiotensin I by liquid chromatography-high-resolution tandem mass spectrometry and the metrological impact on value assignments by amino acid analysis. Anal Bioanal Chem. 2013. PubMed 23708692
- 5.Erckes V, Streuli A, Chamera Rendueles L, et al. Towards a Consensus for the Analysis and Exchange of TFA as a Counterion in Synthetic Peptides and Its Influence on Membrane Permeation. Pharmaceuticals (Basel). 2025. PubMed 40872554
- 6.Cornish J, Callon KE, Lin CQ, et al. Trifluoroacetate, a contaminant in purified proteins, inhibits proliferation of osteoblasts and chondrocytes. Am J Physiol. 1999. PubMed 10567002
- 7.Pace CN, Vajdos F, Fee L, et al. How to measure and predict the molar absorption coefficient of a protein. Protein Sci. 1995. PubMed 8563639
- 8.Anthis NJ, Clore GM. Sequence-specific determination of protein and peptide concentrations by absorbance at 205 nm. Protein Sci. 2013. PubMed 23526461
- 9.Grohganz H, Rischer M, Brandl M. Adsorption of the decapeptide Cetrorelix depends both on the composition of dissolution medium and the type of solid surface. Eur J Pharm Sci. 2004. PubMed 14757490
- 10.Goebel-Stengel M, Stengel A, Taché Y, et al. The importance of using the optimal plasticware and glassware in studies involving peptides. Anal Biochem. 2011. PubMed 21315060
This article summarises published research for educational purposes. It is not medical advice. Compounds sold by Australian Peptide Lab are research reagents for in-vitro laboratory use only, not for human or veterinary use.