Designing In-Vitro Concentration–Response Experiments for Peptides
In-vitro concentration–response design for peptides: ranges, log spacing, controls, replicates, Hill fitting, EC50/IC50 reporting and edge effects.
By the APL Research Team · Updated · First published · 8 min read
A concentration–response experiment estimates three things: potency (EC50 or IC50), the size of the response between its floor and ceiling, and the steepness of the transition. Each estimate is only as good as the concentrations, controls and replication behind it, and most of those decisions are made before the first well is filled. This guide covers in-vitro designs only, in cells, tissues and receptor or enzyme assays; it does not deal with dosing animals or people.
What the curve estimates
The terms used to describe these experiments, including EC50, IC50, pEC50 and Emax, are defined in the International Union of Pharmacology's recommendations on quantitative pharmacology [1]. Most sigmoidal concentration–response data are fitted with the four-parameter logistic model, which is the same function as the Hill equation [2]:
Response = Bottom + (Top − Bottom) / (1 + 10^((logEC50 − log[A]) × nH))
| Parameter | Meaning | What constrains it in the design |
|---|---|---|
| Bottom | Response with no active peptide | Vehicle wells; concentrations below the lower bend |
| Top | Maximal response | Concentrations above the upper bend; reference agonist |
| logEC50 (or logIC50) | Concentration giving a half-maximal effect | Points spread through the transition |
| nH (Hill slope) | Steepness of the transition | Spacing fine enough to place several points on the slope |
There are two definitions of EC50 in use. The relative EC50 is the fitted midpoint between the two plateaus of the curve itself; the absolute EC50 is the concentration giving a response halfway between the 0% and 100% assay controls, and is only appropriate when a stable 100% control exists and the 50% level can be estimated to within about 5% [3].
Choosing the concentration range
The range must reach both plateaus. Guidelines for reportable estimates require at least two concentrations beyond the lower and upper bend points for a relative EC50, and at least two predicted responses on each side of 50% for an absolute EC50 [3]. A curve that never flattens at the top yields an EC50 that is an extrapolation rather than a measurement.
A literature value is a starting point, not a centre to cluster around. Ipamorelin, for example, released growth hormone from primary rat pituitary cells with an EC50 of 1.3 nM [4]; a first experiment in a different system would still span at least three log units either side of that figure, because cell type, receptor density and readout all move potency. Run a wide pilot, then refine.
Two practical limits bound the range:
- The top concentration. High peptide concentrations bring high counter-ion and vehicle loads. Trifluoroacetate, a common counter-ion in HPLC-purified peptides, reduced osteoblast and chondrocyte proliferation at 10⁻⁸ to 10⁻⁷ M, and TFA salts of amylin and calcitonin produced misleading anti-proliferative results; the authors flagged the issue for any work above 10⁻⁹ M peptide [5]. Solubility caps the top end too; see peptide solubility troubleshooting.
- The bottom concentration. Peptides stick to surfaces. Recovery of eight radiolabelled endocrine peptides from glass and plastic tubes varied widely with surface, siliconising reduced it, and 1% BSA improved it [6]. Serial dilution through pipette tips multiplies that exposure, which is one reason non-contact acoustic dispensing has been used to prepare peptide dilution series for potency assays [7].
Log spacing and the number of points
Concentrations are spaced evenly on a log scale because the response is sigmoidal in log concentration. For a Hill slope of 1, the response rises from 10% to 90% over an 81-fold range (1.9 log units); the window narrows to 81^(1/nH), so a slope of 2 compresses it to ninefold. The spacing has to put several points inside that window.
| Dilution step | Log units per step | Points to span 4 log units | Points in the 10–90% window (nH = 1) | Points in the window (nH = 2) |
|---|---|---|---|---|
| 10-fold | 1.0 | 5 | ~2 | ~1 |
| Half-log (3.16-fold) | 0.5 | 9 | ~4 | ~2 |
| 3-fold | 0.48 | 10 | ~4 | ~2 |
| 2-fold | 0.30 | 15 | ~6 | ~3 |
Half-log or threefold spacing is the usual compromise for a first curve. Twofold spacing over a narrower range suits refinement once the EC50 is roughly known, or steep curves.
Worked example: a half-log series
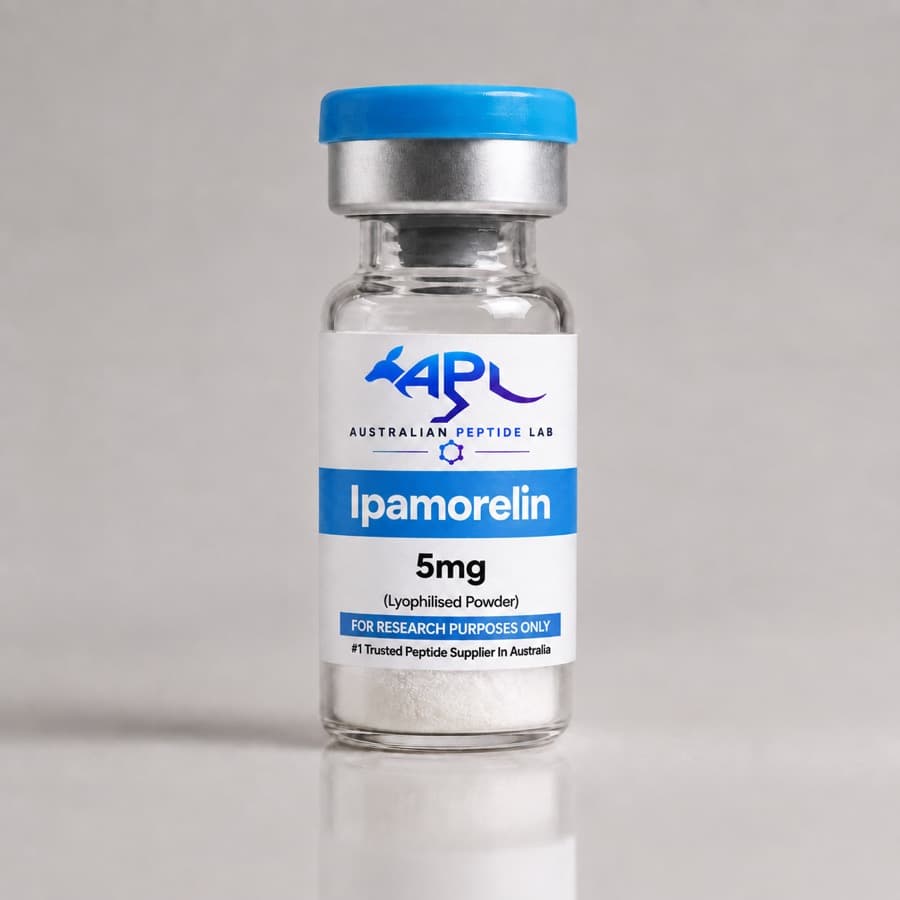
A 5 mg vial of ipamorelin (711.9 g/mol) reconstituted in 2.0 mL gives 2.5 mg/mL, or 3.51 mM if the fill is taken as pure peptide; correct it with the batch's net peptide content for exact work. To run a curve with a 10 µM top concentration, where peptide is added as one-tenth of the final well volume, the top working solution is 100 µM: 28.5 µL of stock made up to 1.0 mL in vehicle-matched medium. Each half-log step then transfers 100 µL into 216 µL of the same medium.
| Point | Working solution (10×) | Final in well |
|---|---|---|
| 1 | 100 µM | 10 µM |
| 2 | 31.6 µM | 3.16 µM |
| 3 | 10.0 µM | 1.00 µM |
| 4 | 3.16 µM | 316 nM |
| 5 | 1.00 µM | 100 nM |
| 6 | 316 nM | 31.6 nM |
| 7 | 100 nM | 10.0 nM |
| 8 | 31.6 nM | 3.16 nM |
| 9 | 10.0 nM | 1.00 nM |
| Vehicle | 0 | 0 |
Because every dilution is made in the same medium, each well carries the same vehicle load. The molarity calculator and dilution calculator reproduce these numbers, and peptide molarity calculations explains the conversions from mg/mL.
Controls
| Control | Purpose | Notes |
|---|---|---|
| Vehicle | Defines the baseline with solvent present | Same final solvent concentration in every well |
| Untreated | Tests the vehicle itself | Worth running whenever the vehicle is not plain medium or buffer |
| Reference agonist or inhibitor | Defines 100% and the assay window | Run on every plate |
| Counter-ion | Separates salt effects from peptide effects | Matched trifluoroacetate, or an acetate or hydrochloride salt [5] |
| Specificity | Shows the response runs through the intended target | Antagonist arm or receptor-null cells, as in ipamorelin's profiling with GHRP and GHRH antagonists [4] |
| Stability | Shows how much intact peptide remains | Peptide in medium without cells, analysed at start and end [8] |
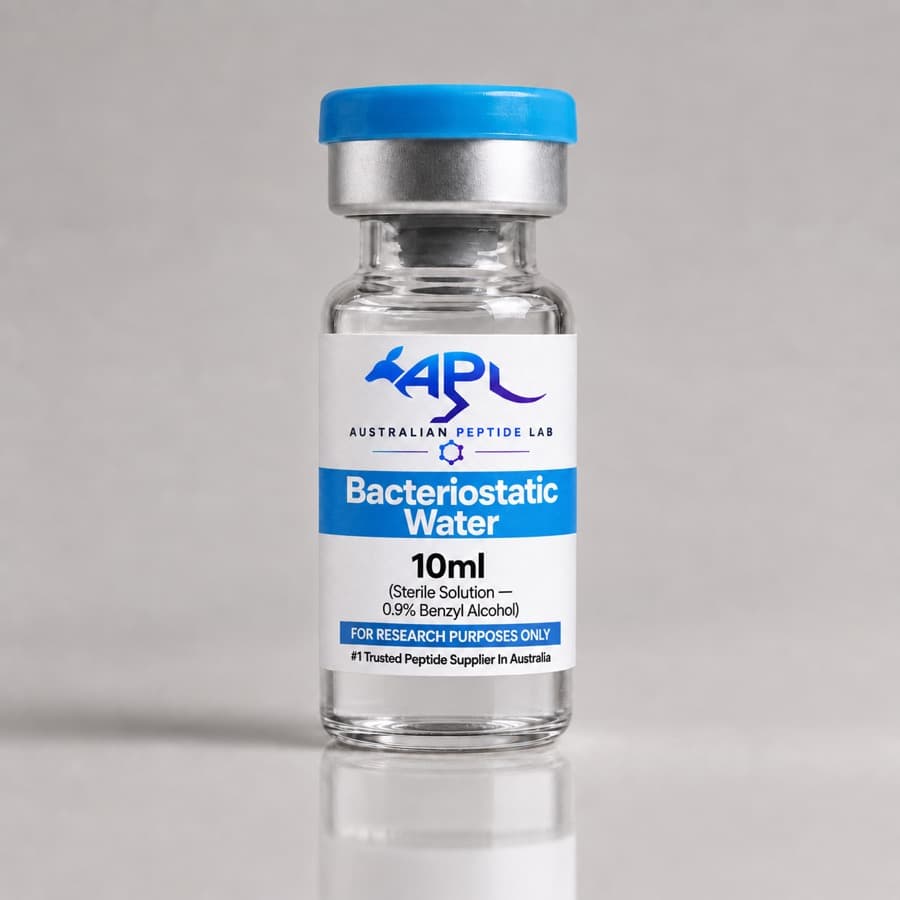
The vehicle deserves the most thought. DMSO at 0.3125% caused minimal cytotoxicity across six cancer cell lines, but the safe limit depended on cell type and exposure time, and ethanol at the same concentration reduced viability by more than 30% after 24 hours [9]. Bacteriostatic water contains 0.9% benzyl alcohol, or 9 mg/mL. In human retinal pigment epithelial cells, benzyl alcohol at 9 mg/mL was toxic within five minutes and 0.225 mg/mL impaired function at two hours, while 0.0225 mg/mL did not [10]. A stock made in bacteriostatic water and diluted 1:100 into medium carries 0.09 mg/mL, between those two levels, so for cell work sterile water or buffer is the cleaner vehicle and any benzyl alcohol must appear in the vehicle control.
Assay quality can be summarised with the Z-factor, which combines the separation between positive and negative controls with their variability [11]: Z = 1 − 3(σp + σn) / |μp − μn|. Values closer to 1 mean a wider window relative to noise; tracking it plate by plate shows when an assay is drifting.
Replication: what counts as n
The unit of replication is whatever receives the treatment independently. A survey of published animal experiments in which parents were treated and offspring measured found pseudoreplication, where non-independent measurements were counted as separate samples, in 46% of studies, and only 22% replicated the correct unit; the authors apply the same reasoning to in-vitro designs, where wells treated from one dilution series on one day are not independent experiments [12].
| Level | Example | What it captures |
|---|---|---|
| Technical replicate | Triplicate wells on one plate | Pipetting and reading noise |
| Independent experiment | A separate day, fresh dilutions, a different cell passage | Run-to-run variation; the n for inference |
| Biological replicate | A different donor, primary isolate or cell line | Whether the result generalises |
A common design is triplicate wells within each run and at least three independent runs, with the curve fitted separately for each run and the pEC50 values then summarised.
Plate layout and edge effects
Wells at the edge of a microplate behave differently from those in the middle. In one study of 96-well plates, outer wells showed 35% lower metabolic activity than central wells in one brand and 16% lower in another, with smaller deficits extending to the second and third rows; loose wrapping during incubation and a buffer between wells reduced the effect [13]. An earlier screening study traced part of the problem to uneven cell settling when freshly seeded plates went straight into a CO₂ incubator, and found that a short rest at room temperature before incubation reduced it [14].
Layout choices that follow:
- Fill the outer ring with medium or buffer rather than samples where the plate format allows.
- Do not run a dilution series along one edge with controls at the other; interleave or randomise positions across runs.
- Put vehicle and reference controls on every plate, in both edge-adjacent and interior positions.
Peptide-specific pitfalls
- Proteolysis in the assay. Human plasma degraded GLP-1 to a truncated metabolite with a half-life of about 20 minutes at 37 °C, a reaction blocked by a DPP-IV inhibitor or by cooling to 4 °C [15]. Stability in plasma and cell-culture supernatants varied widely between model peptides, and precipitating samples with strong acid lost analyte compared with organic solvents [8]. In long incubations, measured potency reflects whatever intact peptide remains.
- Adsorption. Low concentrations lose a larger fraction to tubes, plates and tips [6, 7]. Carrier protein in the diluent, low-binding plastics and fewer transfer steps all help.
- Counter-ions. At high concentrations the salt can contribute its own effect [5]; TFA vs acetate peptide salts covers the choice.
- Stale dilutions. A working dilution kept for a week is a different reagent. Prepare dilutions fresh for each run from frozen single-use aliquots.
Fitting and reporting
Fit the four-parameter model by nonlinear regression on log concentration. Free tools give parameter estimates essentially identical to commercial software and to R's nls function [2], so the choice of package matters less than the choices made within it. Constrain the top or bottom to control values only when those controls are reliable, and say so.
IC50 values for antagonists need particular care. An IC50 depends on the agonist concentration it competes against; the Cheng–Prusoff relationship converts it to an equilibrium dissociation constant, and a modified power equation is needed when the agonist curve's slope differs from 1 [16].
A complete report states:
- pEC50 or pIC50 with its spread across independent runs, the Hill slope and both plateaus;
- the number of independent runs and wells per concentration;
- whether the EC50 is relative or absolute [3], and any constrained parameters;
- the vehicle and its final concentration;
- the peptide's molecular weight, salt form and whether concentrations were corrected for net peptide content;
- incubation time, temperature and medium, including serum.
For the bench
- Convert every stock to molar units before planning a curve; the molarity calculator and reconstitution calculator do the arithmetic.
- Prepare stocks under sterile technique and follow the reconstitution guide for the first dissolution.
- Confirm identity and purity before a large experiment; what HPLC testing measures explains what a purity figure covers.
- For long-acting analogues such as semaglutide, read peptide half-life research before choosing incubation times.
- Combination designs need their own planning; peptide blends explained covers fixed-ratio material and when separate vials are required.
Frequently asked questions
How many concentrations does a concentration–response curve need?
Enough to define both plateaus as well as the transition. One set of published guidelines treats a relative EC50 or IC50 as reportable only when at least two tested concentrations lie beyond each bend point of the curve [3]. In practice that usually means 8–12 concentrations at half-log or threefold spacing across four or more log units, plus vehicle and reference controls on every plate.
Should I average EC50 values or pEC50 values across experiments?
Average the logarithms. Potency estimates are fitted on a log-concentration axis and their errors are roughly symmetrical in log units, so pEC50 (−log EC50) is averaged and the result converted back if a molar EC50 is wanted. Each independent experiment contributes one pEC50; wells within a run are technical replicates, not separate observations [12].
Does the vehicle matter at well under 1%?
It can. In six cancer cell lines, DMSO at 0.3125% was minimally cytotoxic but the tolerated level varied with cell type and exposure time, while ethanol at the same concentration cut viability by more than 30% within 24 hours [9]. Benzyl alcohol, the preservative in bacteriostatic water, damaged retinal pigment epithelial cells at 0.225 mg/mL within two hours [10]. A matched vehicle control is the only way to know.
Why does a peptide look less potent in long incubations or serum-containing medium?
Often because less of it is left. Human plasma converted GLP-1 to an inactive truncated form with a half-life of about 20 minutes at 37 °C [15], and peptide degradation in cell-culture supernatants varied widely between peptides and media [8]. Measuring intact peptide at the start and end of the incubation tells you whether a potency shift is pharmacology or proteolysis; see peptide half-life research.
Can IC50 values be compared between laboratories?
Only with care. An antagonist's IC50 depends on the agonist concentration it competes against, which is why the Cheng–Prusoff relationship is used to convert it to an equilibrium constant, and the conversion itself needs correcting when the agonist curve's slope is not 1 [16]. Whether an EC50 is relative or absolute also changes its value [3]. Compare constants, or IC50s measured under identical conditions.
References
- 1.Neubig RR, Spedding M, Kenakin T, et al. International Union of Pharmacology Committee on Receptor Nomenclature and Drug Classification. XXXVIII. Update on terms and symbols in quantitative pharmacology. Pharmacol Rev. 2003. PubMed 14657418
- 2.Gadagkar SR, Call GB. Computational tools for fitting the Hill equation to dose-response curves. J Pharmacol Toxicol Methods. 2015. PubMed 25157754
- 3.Sebaugh JL. Guidelines for accurate EC50/IC50 estimation. Pharm Stat. 2011. PubMed 22328315
- 4.Raun K, Hansen BS, Johansen NL, et al. Ipamorelin, the first selective growth hormone secretagogue. Eur J Endocrinol. 1998. PubMed 9849822
- 5.Cornish J, Callon KE, Lin CQ, et al. Trifluoroacetate, a contaminant in purified proteins, inhibits proliferation of osteoblasts and chondrocytes. Am J Physiol. 1999. PubMed 10567002
- 6.Goebel-Stengel M, Stengel A, Taché Y, et al. The importance of using the optimal plasticware and glassware in studies involving peptides. Anal Biochem. 2011. PubMed 21315060
- 7.Naylor J, Rossi A, Brankin C, et al. Automated Acoustic Dispensing for the Serial Dilution of Peptide Agonists in Potency Determination Assays. J Vis Exp. 2016. PubMed 27911362
- 8.Kohler A, Jülke EM, Stichel J, et al. Comparison of Protocols to Test Peptide Stability in Blood Plasma and Cell Culture Supernatants. ACS Pharmacol Transl Sci. 2024. PubMed 39539263
- 9.Asiri A, Tasleem M, Al Said M, et al. Optimizing Cell Density and Unveiling Cytotoxic Profiles of DMSO and Ethanol in Six Cancer Cell Lines: Experimental and In Silico Insights. Methods Protoc. 2025. PubMed 40863743
- 10.Chang YS, Wu CL, Tseng SH, et al. In vitro benzyl alcohol cytotoxicity: implications for intravitreal use of triamcinolone acetonide. Exp Eye Res. 2008. PubMed 18420195
- 11.Zhang JH, Chung TD, Oldenburg KR. A Simple Statistical Parameter for Use in Evaluation and Validation of High Throughput Screening Assays. J Biomol Screen. 1999. PubMed 10838414
- 12.Lazic SE, Clarke-Williams CJ, Munafò MR. What exactly is 'N' in cell culture and animal experiments?. PLoS Biol. 2018. PubMed 29617358
- 13.Mansoury M, Hamed M, Karmustaji R, et al. The edge effect: A global problem. The trouble with culturing cells in 96-well plates. Biochem Biophys Rep. 2021. PubMed 33855228
- 14.Lundholt BK, Scudder KM, Pagliaro L. A simple technique for reducing edge effect in cell-based assays. J Biomol Screen. 2003. PubMed 14567784
- 15.Deacon CF, Johnsen AH, Holst JJ. Degradation of glucagon-like peptide-1 by human plasma in vitro yields an N-terminally truncated peptide that is a major endogenous metabolite in vivo. J Clin Endocrinol Metab. 1995. PubMed 7883856
- 16.Cheng HC. The power issue: determination of KB or Ki from IC50. A closer look at the Cheng-Prusoff equation, the Schild plot and related power equations. J Pharmacol Toxicol Methods. 2001. PubMed 12481843
This article summarises published research for educational purposes. It is not medical advice. Compounds sold by Australian Peptide Lab are research reagents for in-vitro laboratory use only, not for human or veterinary use.