Peptide Blends Explained: Mass vs Molar Ratios, Analysis and Experimental Design
How fixed-ratio co-lyophilised peptide blends work: mass vs molar ratios, analytical challenges, and when separate vials suit experimental design better.
By the APL Research Team · Updated · First published · 6 min read
A peptide blend is two peptides co-lyophilised in one vial at a fixed ratio by mass. That is convenient when the fixed combination is itself the object of study, but it removes control over the ratio, makes analysis harder, and cannot supply the single-agent arms that most combination experiments need. This guide explains what a blend's label ratio means in molar terms, how blends are analysed, and when separate vials serve a design better.
What a blend is
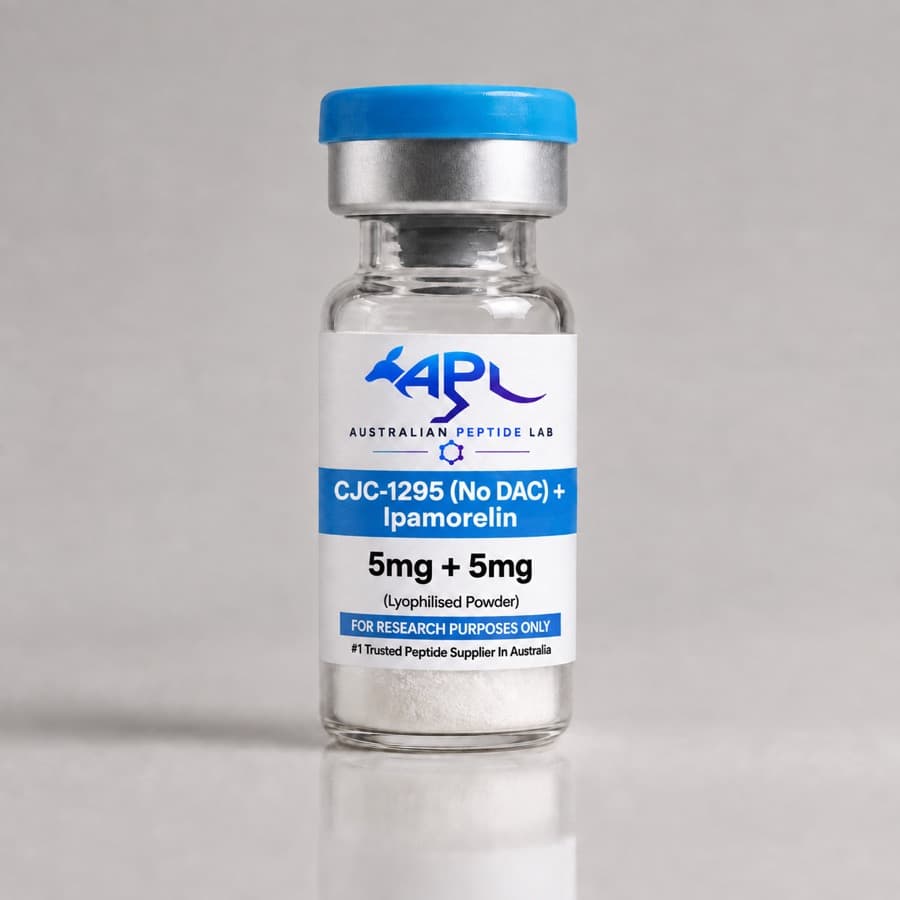
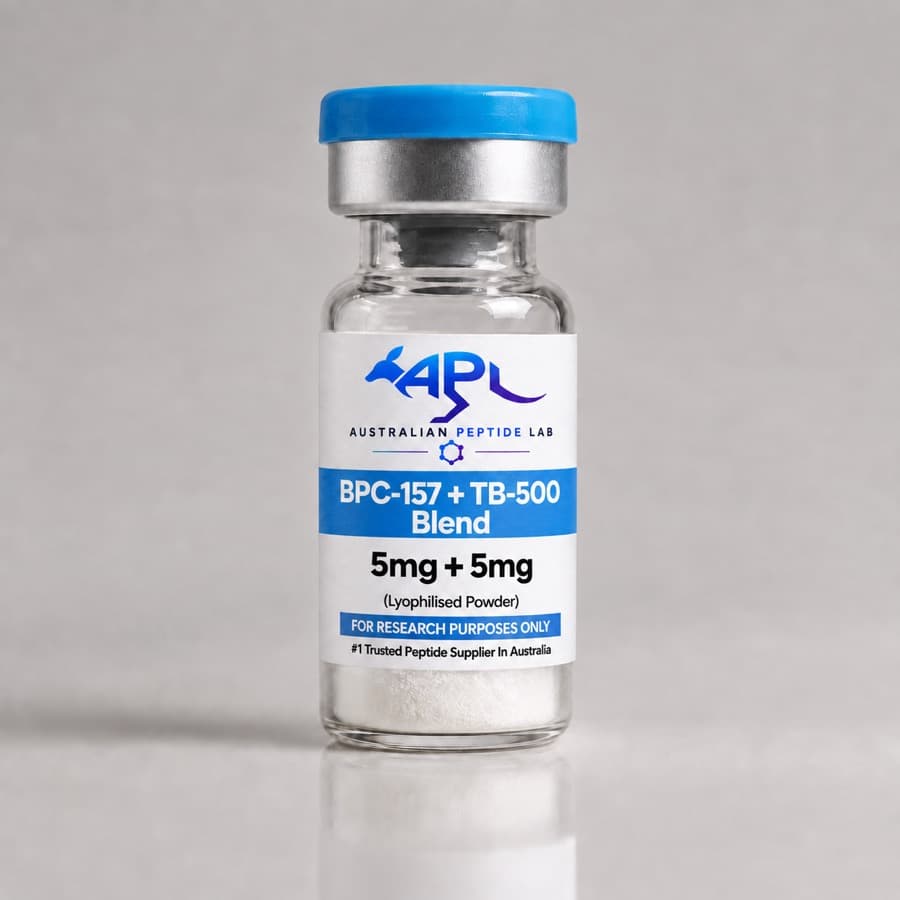
The catalogue has two blends, each sold alongside its single-peptide components:
| Blend | Fill (by mass) | Components available singly |
|---|---|---|
| CJC-1295 (No DAC) + Ipamorelin | 5 mg + 5 mg | CJC-1295 (no DAC), ipamorelin |
| BPC-157 + TB-500 | 5 mg + 5 mg, 10 mg + 10 mg | BPC-157, TB-500 |
Both are supplied as co-lyophilised powder in a sealed glass vial, with a ≥99% HPLC purity specification for each peptide. A blend is not a new molecule: on reconstitution the two peptides dissolve into one solution and behave as two independent solutes.
Blends exist because particular pairs recur in the literature. Growth hormone-releasing peptides and GHRH released growth hormone synergistically in rats, which the authors interpreted as evidence of independent mechanisms [1]; ipamorelin acts through the GHRP receptor rather than the GHRH receptor [2], which is the rationale for pairing it with a GHRH analogue. BPC-157 and TB-500 were tested side by side and together in a four-arm rat Achilles study [3]. The evidence behind each pairing is covered in BPC-157 and TB-500 compared and the TB-500 research guide.
Mass ratio versus molar ratio
A blend's label ratio is by mass. Pharmacology works in moles, and the molar ratio is (m₁ ÷ MW₁) ÷ (m₂ ÷ MW₂). For peptides of different size, equal milligrams means unequal numbers of molecules.
| Blend (5 mg + 5 mg) | Component | MW (g/mol) | Amount (µmol) | Molar ratio |
|---|---|---|---|---|
| CJC-1295 (no DAC) + ipamorelin | CJC-1295 (no DAC), 29 residues | 3367.9 | 1.48 | 1 : 4.7 |
| Ipamorelin, 5 residues | 711.9 | 7.02 | ||
| BPC-157 + TB-500, if TB-500 is full-length thymosin β4 | BPC-157 | 1419.5 | 3.52 | 3.5 : 1 |
| Thymosin β4, 43 residues | ~4963 | 1.01 | ||
| BPC-157 + TB-500, if TB-500 is Ac-LKKTETQ | BPC-157 | 1419.5 | 3.52 | 1 : 1.6 |
| Ac-LKKTETQ, thymosin β4 17–23 | 889.0 | 5.62 |
The two BPC-157 + TB-500 rows are not a hypothetical. "TB-500" is used for full-length thymosin β4 and also for a short acetylated fragment: a doping-control laboratory identified the N-acetylated 17–23 fragment, Ac-LKKTETQ, in a product sold under that name [4]. Depending on which molecule is present, the same "5 mg + 5 mg" label gives a molar ratio of 3.5:1 or 1:1.6. The identity and measured mass of each component belong in the batch documentation, and how to read peptide sequences explains the notation.
Molar amounts in the table assume each fill is pure peptide. In practice each component carries its own counter-ion and water content, so the net peptide content of each can differ, and the true molar ratio shifts accordingly.
Worked example: concentrations after reconstitution
| Blend and volume | Component | mg/mL | Molar concentration |
|---|---|---|---|
| CJC-1295 + ipamorelin (5 + 5 mg) in 2.0 mL | CJC-1295 (no DAC) | 2.5 | 742 µM |
| Ipamorelin | 2.5 | 3.51 mM | |
| BPC-157 + TB-500 (10 + 10 mg) in 2.0 mL | BPC-157 | 5.0 | 3.52 mM |
| TB-500 as thymosin β4 | 5.0 | 1.01 mM |
Diluting a blend sets one component's concentration and fixes the other. A well containing 100 nM ipamorelin from the CJC-1295 + ipamorelin blend necessarily contains about 21 nM CJC-1295. The reconstitution calculator and peptide molarity calculations cover the arithmetic for each component.
Analytical challenges
Testing a blend is harder than testing either component alone.
| Challenge | Why it arises | How it is handled |
|---|---|---|
| Two main peaks | Each component and its impurities must be resolved from the other | Purity reported per component; an HPLC method that separates both |
| Peak area is not mass | UV response at 214 nm depends on composition: peptide bonds, Trp, Phe, Tyr, His and in-chain Pro absorb differently [5] | Calibrate each component against its own reference |
| Identity of each component | Names such as TB-500 cover different molecules [4] | Mass spectrometry of both components |
| Intended versus contaminating peptides | Unrelated peptides have been found as contaminants in peptide products [6] | Specification defines exactly which two peptides belong |
| Multi-analyte methods | Each peptide needs its own identification criteria | LC-MS/MS screens built for many peptides at once, with UHPLC-DAD quantification [7] |
The UV point is the one most often missed. At 214 nm the peptide bond has a molar extinction coefficient of 923 M⁻¹ cm⁻¹, tryptophan absorbs about 30 times more, phenylalanine, tyrosine and histidine about six times more, and proline within a chain about three times more [5]. Two peptides of different length and composition at equal mass therefore give unequal peak areas, and an area ratio says nothing about the mass ratio without calibration. What HPLC testing measures and understanding certificates of analysis cover how such results are reported.
The ratio can also drift after the vial is opened. Peptides lose different fractions to tube and plate surfaces [8], and degradation in plasma and cell-culture supernatants varied strongly between peptides [9], so at low concentrations or over long incubations the ratio in the well may no longer match the ratio in the vial.
Experimental design: when a blend fits
Interaction analysis needs single agents. Assessing synergy or antagonism requires the additive isobole, which is built from each drug's individual potency [10], and the combination index method, in which values below, equal to and above 1 indicate synergy, additivity and antagonism, likewise starts from each agent's own dose–effect curve [11]. A blend supplies only the combination.
The rat Achilles study illustrates the standard design: control, BPC-157, TB-500 and the combination, eight animals per arm, randomised [3]. Only the fourth arm could have come from a blend, and the finding that the combination was no better than either peptide alone [3] depended on having the other three.
| Design goal | Blend | Separate vials |
|---|---|---|
| Replicate a published fixed combination | Suitable if the ratio matches | Suitable |
| Single-agent control arms | Not possible | Required |
| Test for synergy or antagonism | Fixed-ratio mixture only; singles still needed | Full design |
| Vary the ratio | Not possible | Possible |
| Concentration–response curve of one component | Not possible | Possible |
| Fewer handling and pipetting steps for a fixed mixture | Advantage | More steps |
In short, a blend is a convenience for experiments where the fixed combination is the variable of interest. Wherever a question involves either component separately, or the ratio itself, separate vials are needed. Designing concentration–response experiments covers range-finding and controls for each arm.
Handling a blend
- One solvent for two peptides. The diluent has to dissolve both components; a sequence that is acidic and one that is basic may prefer different conditions. The solubility troubleshooting guide covers difficult cases.
- Storage. Blends carry the same instructions as the single peptides: −20 °C lyophilised, 2–8 °C once reconstituted. Split stocks into single-use aliquots and label each with both concentrations.
- Reconstitution. Follow the peptide reconstitution guide, and note that any vehicle additive, such as the benzyl alcohol in bacteriostatic water, is present for both peptides and belongs in the vehicle control.
For the bench
- Convert both components to molar units before designing anything; equal milligrams rarely means equal molecules.
- Confirm the identity and mass of each component from the batch documentation, particularly for names such as TB-500.
- Plan single-agent arms from separate vials whenever the design asks about either peptide alone.
- Measure each component, not just the mixture, when stability or adsorption could shift the ratio.
- For background on what these reagents are, see what are research peptides.
Frequently asked questions
Is a 5 mg + 5 mg blend a 1:1 ratio?
By mass, yes; by number of molecules, almost never. In the CJC-1295 (no DAC) + ipamorelin blend, 5 mg of each is about 1.48 µmol of CJC-1295 and 7.02 µmol of ipamorelin, a molar ratio near 1:4.7, because ipamorelin is less than a quarter of the size. Receptor-level effects depend on molar concentrations, so convert before planning; the molarity calculator does this for each component.
How is purity reported for a blend?
Per component. Each peptide has its own main peak and impurity profile, and the blend listings carry a ≥99% HPLC specification for each peptide, with batch documentation available on request. Peak areas cannot be read directly as a mass ratio, because UV absorbance at 214 nm depends on amino-acid composition: tryptophan absorbs about 30 times more than a peptide bond, and phenylalanine, tyrosine and histidine about six times more [5].
Does putting two peptides in one vial make them act together?
Co-lyophilisation is a packaging choice; whether two peptides interact is a separate experimental question. Some pairings have a mechanistic rationale, such as the synergistic growth hormone release reported in rats when a GHRP and GHRH were given together [1]. Others have not shown additivity: in a randomised rat Achilles tendon study, combined BPC-157 and TB-500 performed no better than either peptide alone [3].
Why are CJC-1295 and ipamorelin paired?
They act at different receptors on the same axis. CJC-1295 (no DAC) is a GHRH analogue, while ipamorelin releases growth hormone through a GHRP-like receptor, the receptor now usually called the ghrelin receptor; profiling with GHRP and GHRH antagonists placed its action there rather than at the GHRH receptor [2]. A recent narrative review noted that published data on the combination are limited to animal studies [12]. The GH secretagogue range lists both single peptides and the blend.
Can a blend be used for a concentration–response curve?
Only for the fixed combination itself. Diluting a blend changes both peptides together, so neither component's curve can be measured on its own, and interaction analyses need the single-agent curves to define what additivity would look like [10]. For most designs, separate vials of each peptide are the right starting material; see designing concentration–response experiments.
References
- 1.Bowers CY, Sartor AO, Reynolds GA, et al. On the actions of the growth hormone-releasing hexapeptide, GHRP. Endocrinology. 1991. PubMed 2004615
- 2.Raun K, Hansen BS, Johansen NL, et al. Ipamorelin, the first selective growth hormone secretagogue. Eur J Endocrinol. 1998. PubMed 9849822
- 3.Biçer O, Adanir O, Güleryüz Y, et al. Effects of BPC-157 and TB-500 on Achilles tendon healing in rats: A histopathological and biomechanical study. Jt Dis Relat Surg. 2026. PubMed 42542926
- 4.Esposito S, Deventer K, Goeman J, et al. Synthesis and characterization of the N-terminal acetylated 17-23 fragment of thymosin beta 4 identified in TB-500, a product suspected to possess doping potential. Drug Test Anal. 2012. PubMed 22962027
- 5.Kuipers BJ, Gruppen H. Prediction of molar extinction coefficients of proteins and peptides using UV absorption of the constituent amino acids at 214 nm to enable quantitative reverse phase high-performance liquid chromatography-mass spectrometry analysis. J Agric Food Chem. 2007. PubMed 17539659
- 6.D'Hondt M, Bracke N, Taevernier L, et al. Related impurities in peptide medicines. J Pharm Biomed Anal. 2014. PubMed 25044089
- 7.Vanhee C, Janvier S, Desmedt B, et al. Analysis of illegal peptide biopharmaceuticals frequently encountered by controlling agencies. Talanta. 2015. PubMed 26003685
- 8.Goebel-Stengel M, Stengel A, Taché Y, et al. The importance of using the optimal plasticware and glassware in studies involving peptides. Anal Biochem. 2011. PubMed 21315060
- 9.Kohler A, Jülke EM, Stichel J, et al. Comparison of Protocols to Test Peptide Stability in Blood Plasma and Cell Culture Supernatants. ACS Pharmacol Transl Sci. 2024. PubMed 39539263
- 10.Tallarida RJ. An overview of drug combination analysis with isobolograms. J Pharmacol Exp Ther. 2006. PubMed 16670349
- 11.Chou TC. Theoretical basis, experimental design, and computerized simulation of synergism and antagonism in drug combination studies. Pharmacol Rev. 2006. PubMed 16968952
- 12.Mayfield CK, Bolia IK, Feingold CL, et al. Injectable Peptide Therapy: A Primer for Orthopaedic and Sports Medicine Physicians. Am J Sports Med. 2026. PubMed 41476424
This article summarises published research for educational purposes. It is not medical advice. Compounds sold by Australian Peptide Lab are research reagents for in-vitro laboratory use only, not for human or veterinary use.